


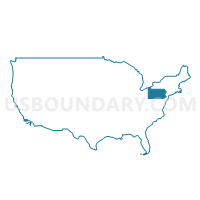
Delaware Valley School District, Pennsylvania
About

** Data sources from census 2010 **
Maps


Graphs


Neighbors
Neighoring Unified School District (by Name) Neighboring Unified School District on the Map
- East Stroudsburg Area School District, PA
- Eldred Central School District, NY
- Port Jervis City School District, NY
- Wallenpaupack Area School District, PA
Top 10 Neighboring County (by Population) Neighboring County on the Map
- Orange County, NY (372,813)
- Sussex County, NJ (149,265)
- Sullivan County, NY (77,547)
- Pike County, PA (57,369)
Top 10 Neighboring County Subdivision (by Population) Neighboring County Subdivision on the Map
- Dingman township, Pike County, PA (11,926)
- Lehman township, Pike County, PA (10,663)
- Port Jervis city, Orange County, NY (8,828)
- Deerpark town, Orange County, NY (7,901)
- Delaware township, Pike County, PA (7,396)
- Lackawaxen township, Pike County, PA (4,994)
- Blooming Grove township, Pike County, PA (4,819)
- Montague township, Sussex County, NJ (3,847)
- Highland town, Sullivan County, NY (2,530)
- Shohola township, Pike County, PA (2,475)
Top 10 Neighboring Place (by Population) Neighboring Place on the Map
- Port Jervis city, NY (8,828)
- Hemlock Farms CDP, PA (3,271)
- Pocono Woodland Lakes CDP, PA (3,209)
- Matamoras borough, PA (2,469)
- Gold Key Lake CDP, PA (1,830)
- Sunrise Lake CDP, PA (1,387)
- Birchwood Lakes CDP, PA (1,386)
- Conashaugh Lakes CDP, PA (1,294)
- Milford borough, PA (1,021)
Top 10 Neighboring Elementary School District (by Population) Neighboring Elementary School District on the Map
- Montague Township School District, NJ (3,847)
- Sandyston-Walpack Township School District, NJ (2,014)
Top 10 Neighboring Secondary School District (by Population) Neighboring Secondary School District on the Map
Top 10 Neighboring State Legislative District Lower Chamber (by Population) Neighboring State Legislative District Lower Chamber on the Map
- General Assembly District 24, NJ (215,703)
- Assembly District 98, NY (138,734)
- State House District 189, PA (76,401)
- State House District 139, PA (67,006)
Top 10 Neighboring State Legislative District Upper Chamber (by Population) Neighboring State Legislative District Upper Chamber on the Map
- State Senate District 42, NY (313,027)
- State Senate District 20, PA (273,416)
- State Senate District 24, NJ (215,703)
Top 10 Neighboring 111th Congressional District (by Population) Neighboring 111th Congressional District on the Map
- Congressional District 19, NY (699,959)
- Congressional District 22, NY (679,297)
- Congressional District 10, PA (669,257)
- Congressional District 5, NJ (666,551)
Top 10 Neighboring Census Tract (by Population) Neighboring Census Tract on the Map
- Census Tract 9506.06, Pike County, PA (6,079)
- Census Tract 9506.05, Pike County, PA (5,847)
- Census Tract 9508.01, Pike County, PA (5,278)
- Census Tract 9509, Pike County, PA (4,441)
- Census Tract 3710, Sussex County, NJ (3,847)
- Census Tract 9507.01, Pike County, PA (3,817)
- Census Tract 116.02, Orange County, NY (3,732)
- Census Tract 9507.02, Pike County, PA (3,579)
- Census Tract 9505.02, Pike County, PA (3,163)
- Census Tract 9524, Sullivan County, NY (2,530)
Top 10 Neighboring 5-Digit ZIP Code Tabulation Area (by Population) Neighboring 5-Digit ZIP Code Tabulation Area on the Map
- 18337, PA (14,572)
- 12771, NY (14,511)
- 18428, PA (12,012)
- 18324, PA (9,714)
- 18328, PA (7,759)
- 07827, NJ (4,244)
- 18336, PA (4,082)
- 18458, PA (3,017)
- 12780, NY (2,312)
- 18425, PA (1,354)